How to visualize the grains and their evolution
We provide a number of shell scripts to visualize the output. You basically need gnuplot to run these postprocessing scripts:
- plotNetworkAtTime.sh
execute: sh plotNetworkAtTime.sh ‘timestep’
The script will draw the polycrystal at time “timestep”. “timestep” has to be a multiple of the “Analysisstep” defined in the parameters.xml.
This is a possible result:
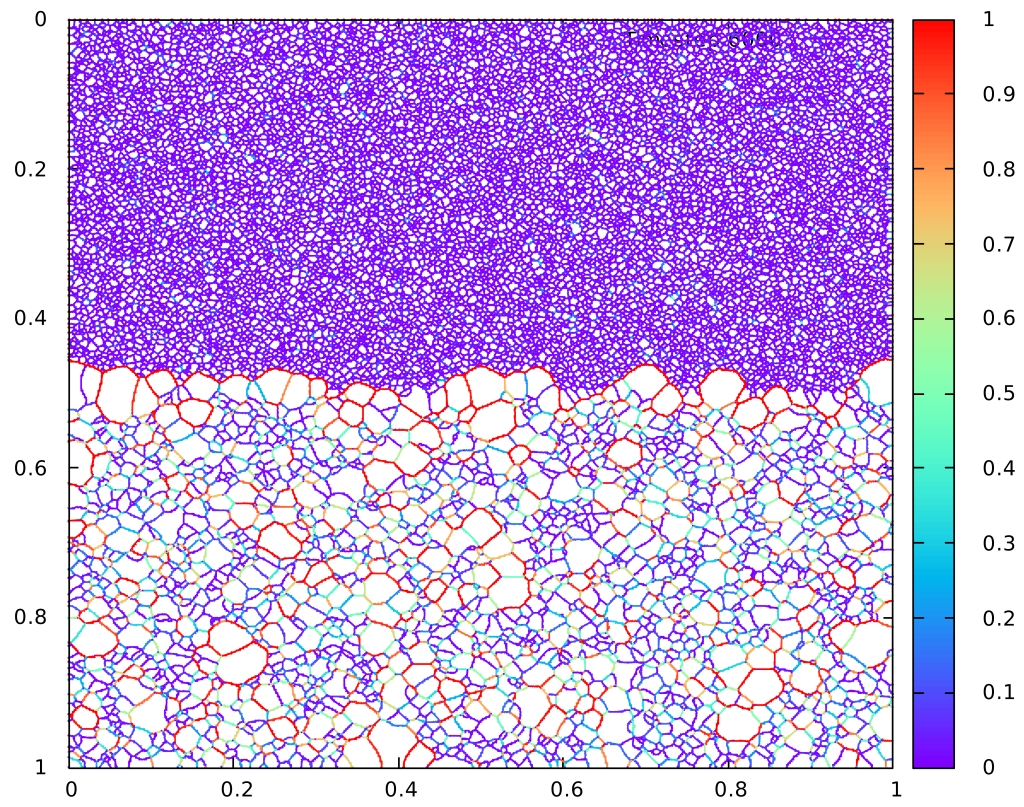
The colors of the GB describe teh charcater of the GB (mobility times energy).
- produceAnimation_aux.sh
execute: sh plotNetworkAtTime.sh ‘analysisstep’
The script will draw the evolution of the polycrystal by composing a .gif file. “analysisstep” has to be a multiple of the “Analysisstep” defined in the parameters.xml.